An introduction to the PolyAnalyst interface
This topic provides an overview of the web version of the PolyAnalyst Analytical Client window.
The PolyAnalyst interface is organized into the following general areas:
Note that your window may appear differently, as various components may be hidden, resized, and moved.
You can also take an introduction tour described further.
Menu
The menu button, located in the upper-left corner, opens various options to operate PolyAnalyst system:
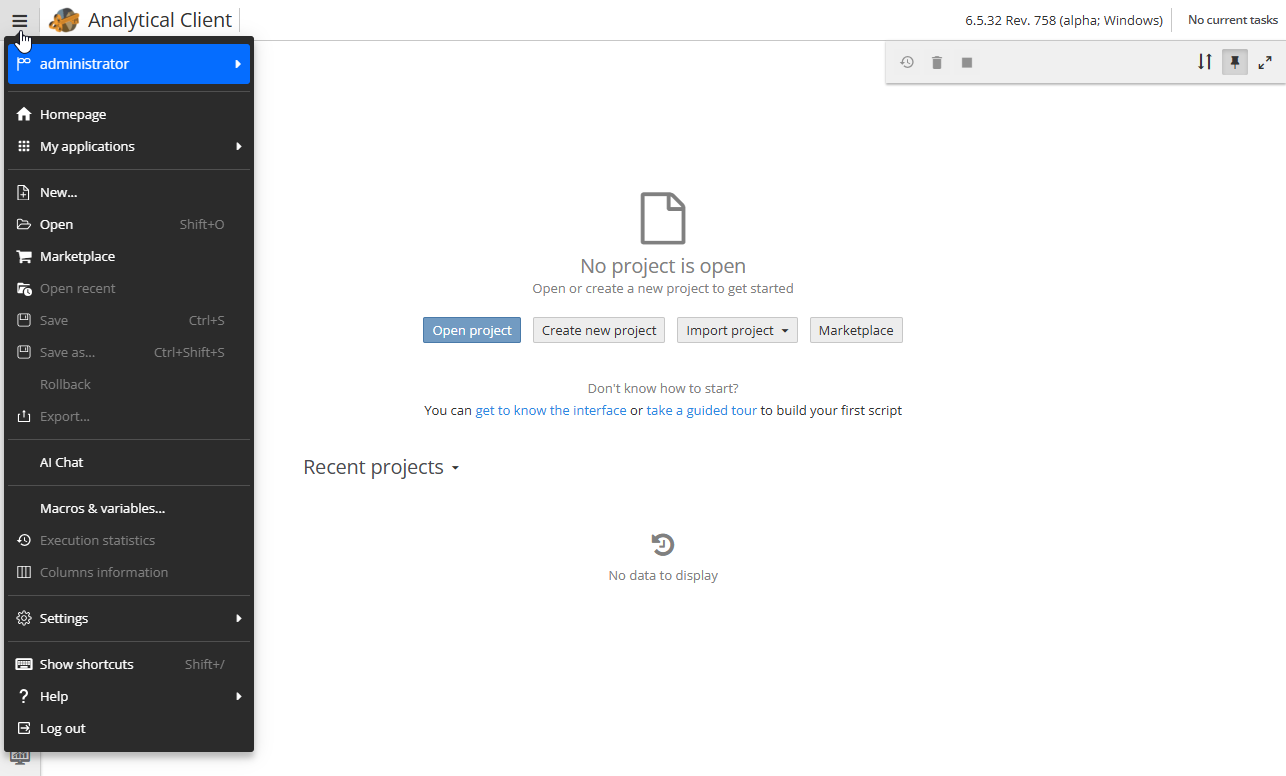
There are following menu items:
-
Username:
-
Edit profile… – changing your user profile settings, such as your password and other personal information.
-
User settings… – editing users' personal preferences for editing project properties and node configuration.
-
Switch language – allows selecting the language of the interface.
-
-
Homepage – opens the PolyAnalyst home page.
-
My applications – allows opening the following applications:
-
Administrative Tool – opens the Administrative Tool to configure various administrative functions (available to administrators only).
-
Analytical Client – opens the Analytical client to perform various operations and analysis on your data (available under license).
-
Report Editor – opens the Report Editor, to visualize results of your analysis and share your findings with others (available under license).
-
Publications – opens the Publications (available under license).
-
Scheduler – opens the Scheduler to create and manage schedules (available to non-guests).
-
PolyAnalyst Drive – opens the storage of all user’s files that are accessible to PolyAnalyst Server (available to non-guests).
-
Dictionary Manager – opens the Dictionary Manager to work with PolyAnalyst dictionaries (available under license).
-
| It is also possible to open the My applications menu by right-clicking the menu button. |
Options for frequently performed actions with projects as follows:
-
New… – creates a new project.
-
Open – opens a new project.
-
Open recent – opens a recently created project.
-
Save – saves a project.
-
Save as… – perfoms the same operation though a folder can changed and the name of the project.
-
Rollback – returns a project to the last saved state.
-
Export – exports a project (see here for more information).
-
Force unload – unloads a project from the server side.
-
Create application – creates an application from the project.
Note that the Create application option is available only if the Application Builder server is added as a service. Contact your IT team for more information.
Other options provide additional features to see/change within the project:
-
Macros & variables – click to set users' macros and variables.
-
Execution statistics – information about the execution statistics of the nodes of the project.
-
Columns information – information about columns (name, type, etc.) used in nodes.
-
Settings… – settings of the currently opened project.
-
Show shortcuts – a list of hotkeys used in PolyAnalyst.
-
Help:
-
Onboarding for beginners – click to start an onboarding tour.
-
Technical support – click to open the technical support details.
-
User manual and User manual (PDF) – click to open the User manual in your browser or download the User manual in PDF format.
-
What’s new – see what updates have been made to the specified versions (in a presentation format).
-
About… – click to see information on the PolyAnalyst version.
-
-
Log out – click to log out from your user profile; the sign in window will appear.
When there is a project opened, the menu will look as follows:
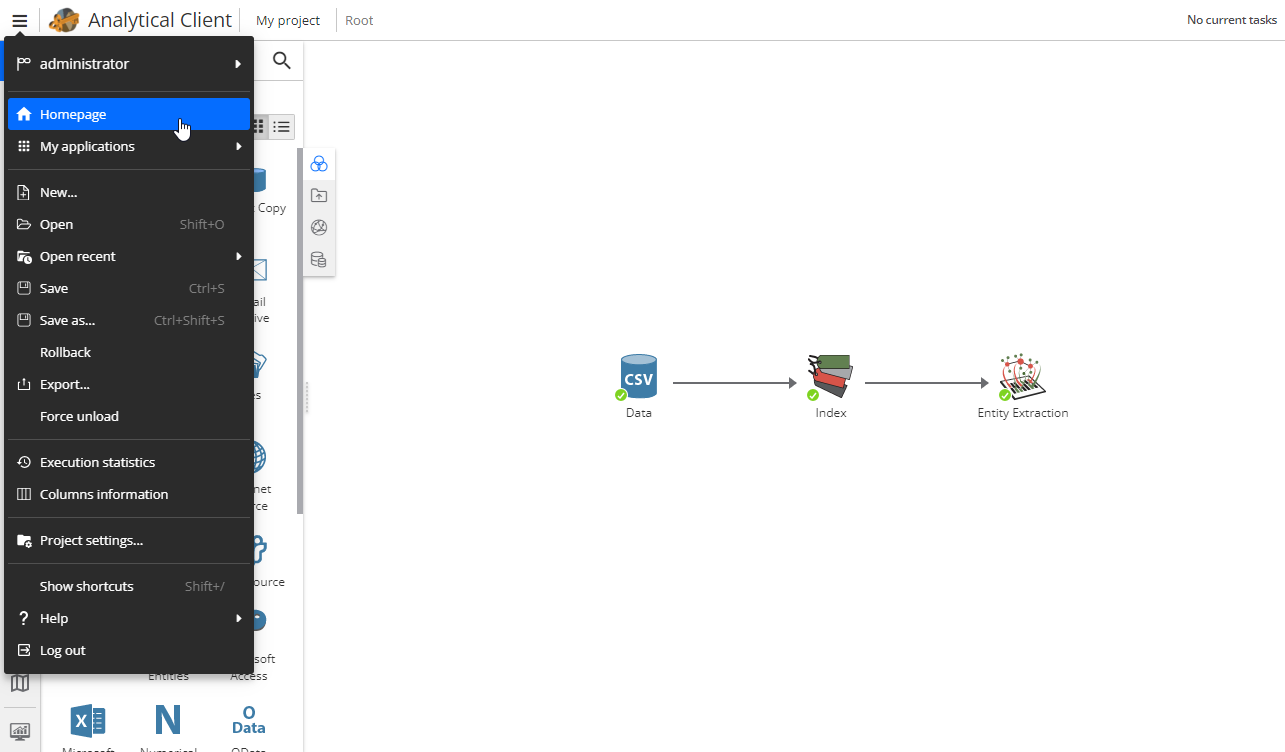
The Force unload option allows you to unload a project from the server in case the project execution has failed or there are any other issues which prevent common project unloading.
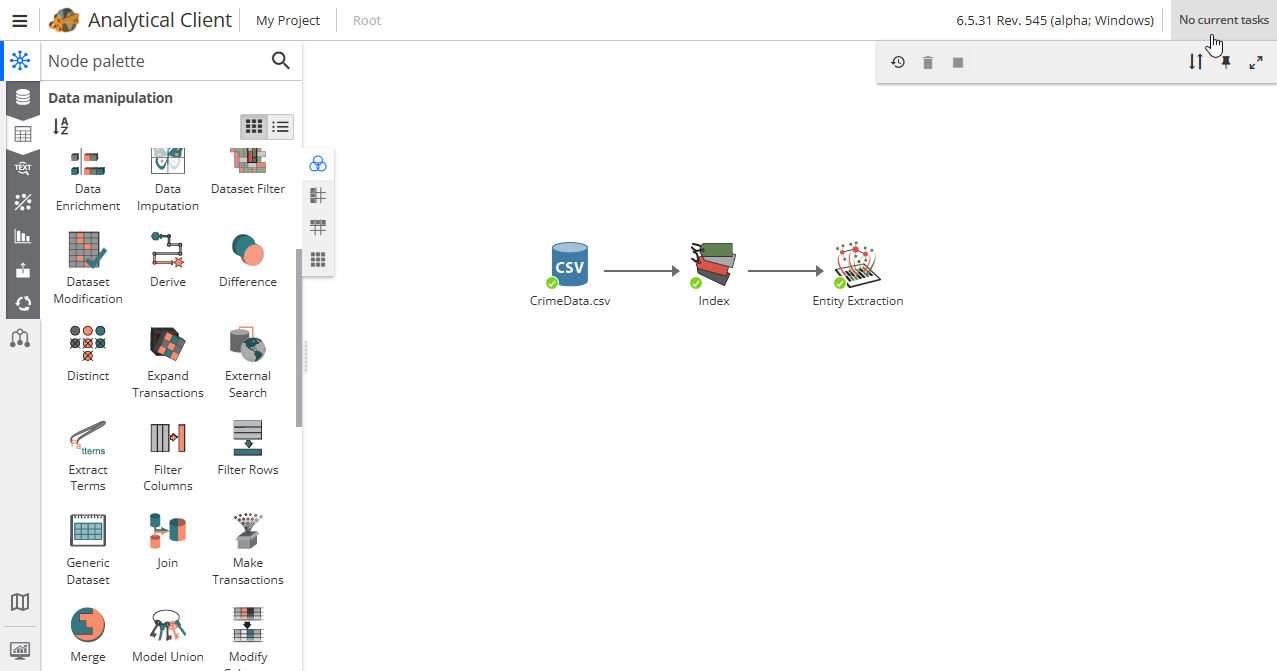
Node palette
This area contains an organized list of items that you can add to your project. The items are referred to as nodes.
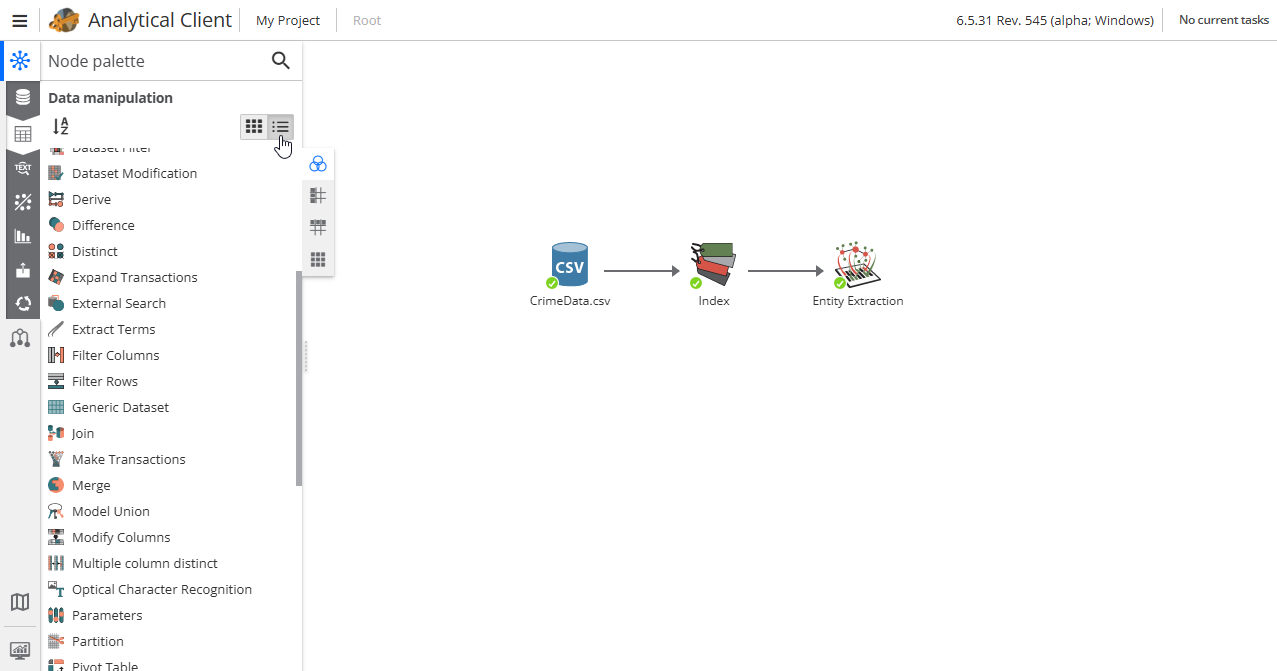
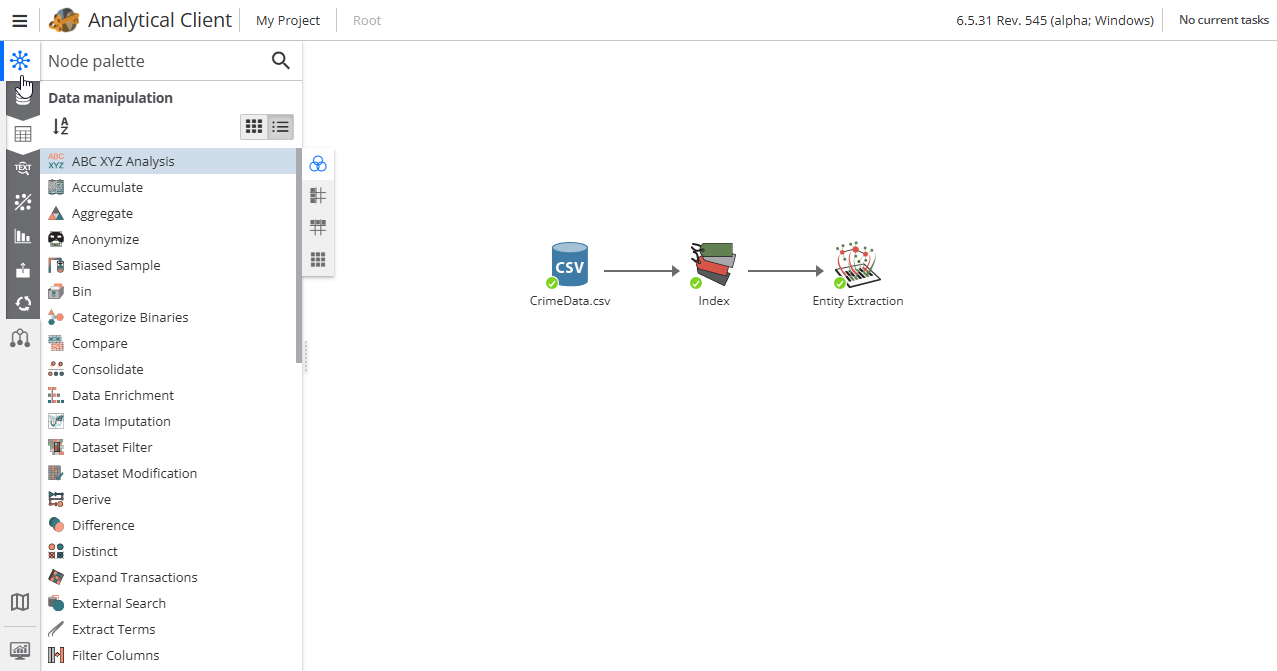
The nodes in the node palette are organized into several categories according to the general function of nodes. Use the symbols in the left panel to see corresponding nodes in every category:
You can also search for a specific node using the magnifying icon in the upper-right corner of the node palette.
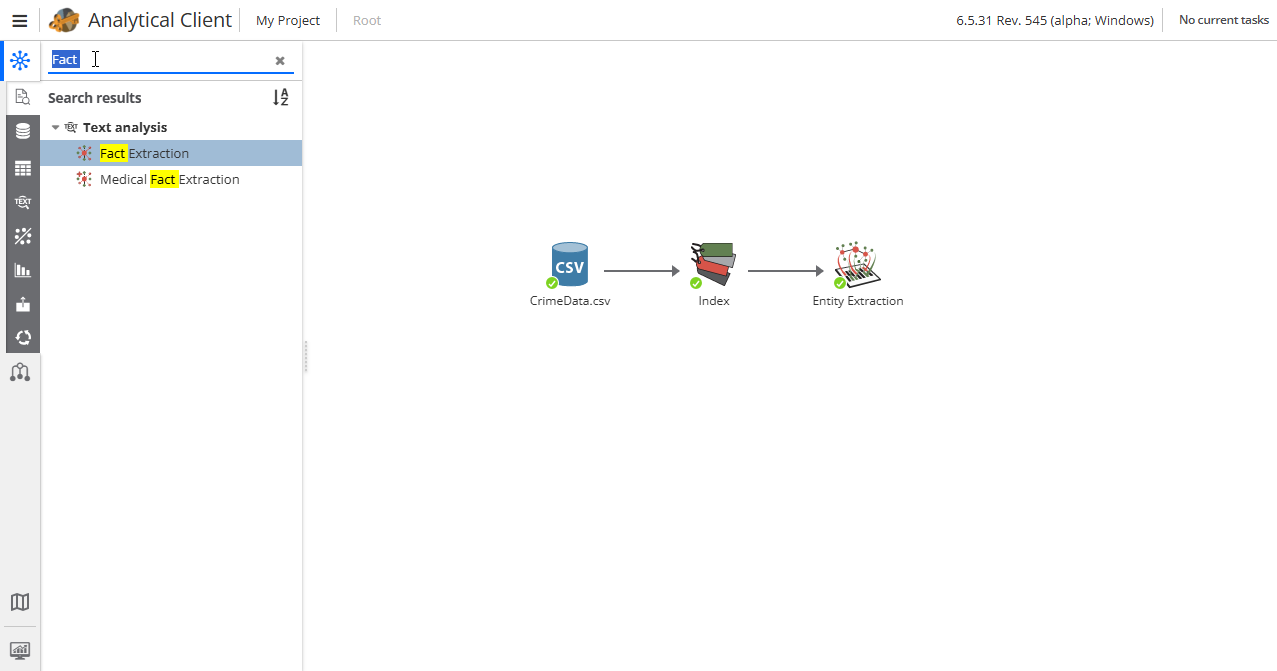
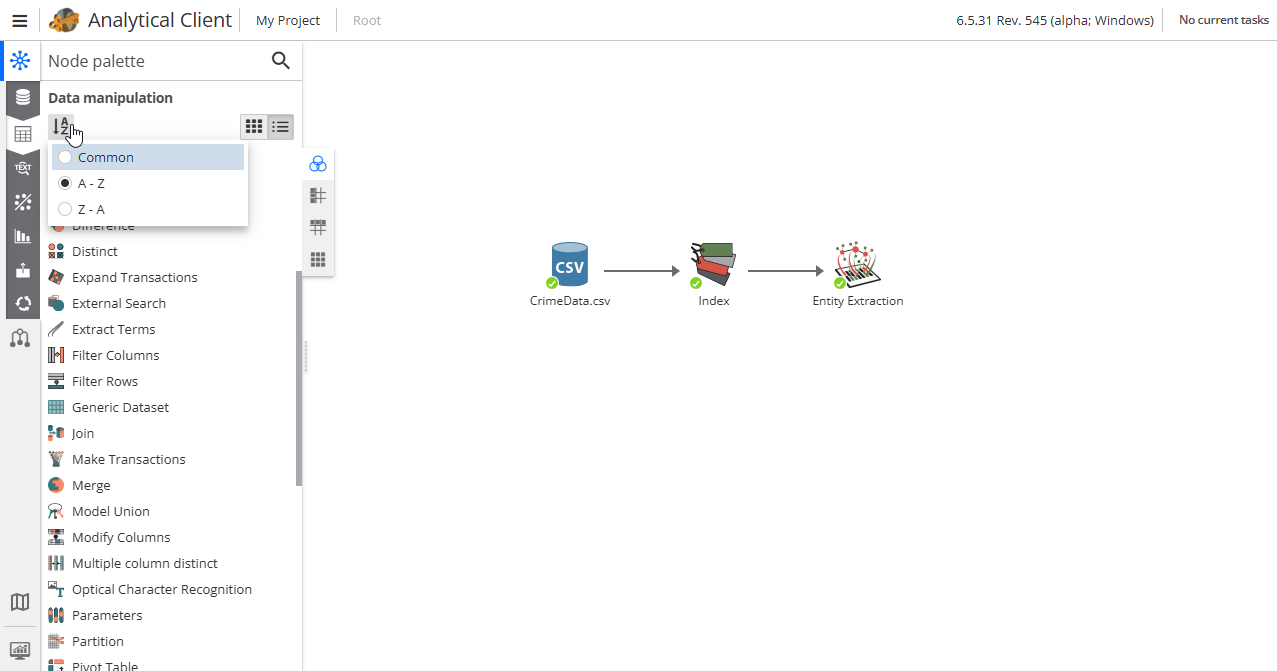
For your convenience, you can configure the view of the node palette by selecting the node palette view as List or Grid, using the buttons to the right or you can sort nodes by pressing the corresponding button.
Toggle the node palette by pressing the appropriate button in the upper-left corner.
To see a list of all the nodes of the specific script, press the Project tree button.
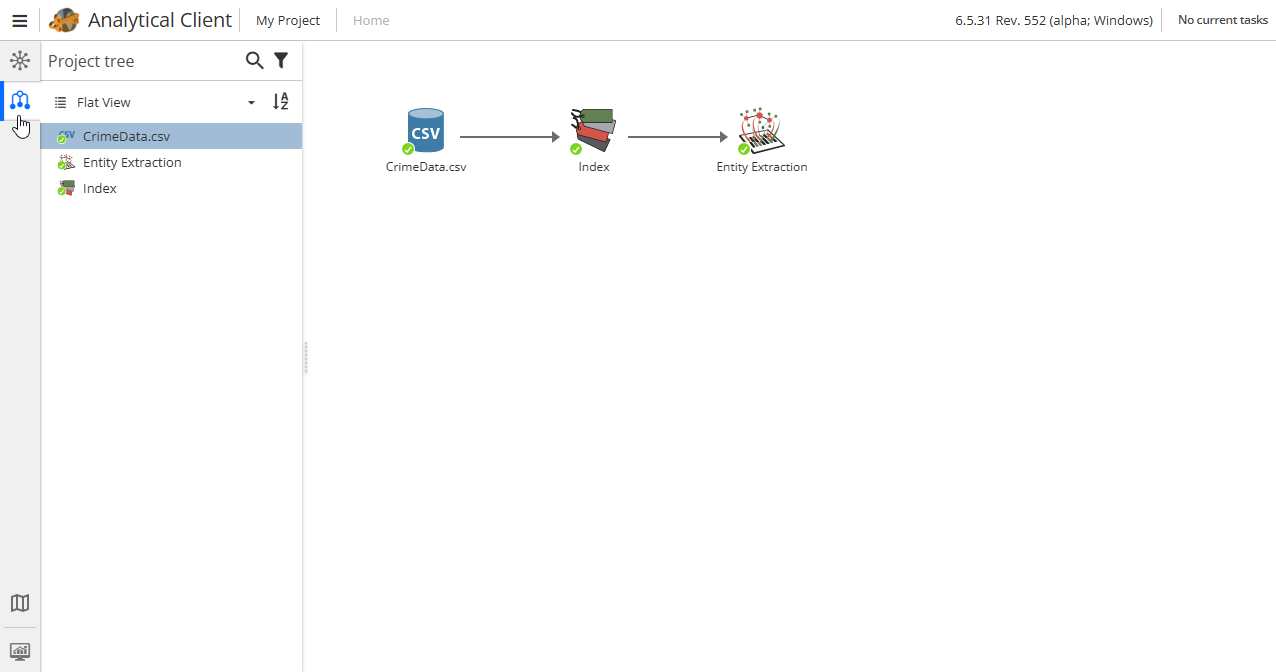
The script nodes can be filtered using the drop-down menu above the node list:
-
Flat view – the nodes are shown as a list.
-
Tree view – the nodes are shown as a tree, according to the parent-child dependencies.
-
Node category view – the nodes are grouped according to the categories. Select the grouping method if necessary:
-
Group by node subcategory – the nodes are grouped according to the categories.
-
Group by node type – the nodes are grouped according to the node type (function).
-
| If you have a large number of nodes in your script, it may be difficult for you to find a particular node in the flowchart. In this case double-click the node name in the Project tree, and the node will be highlighted in the flowchart. |
Task list
This panel displays the progress of any currently running operations.
See the section on troubleshooting the task list issues for more information.
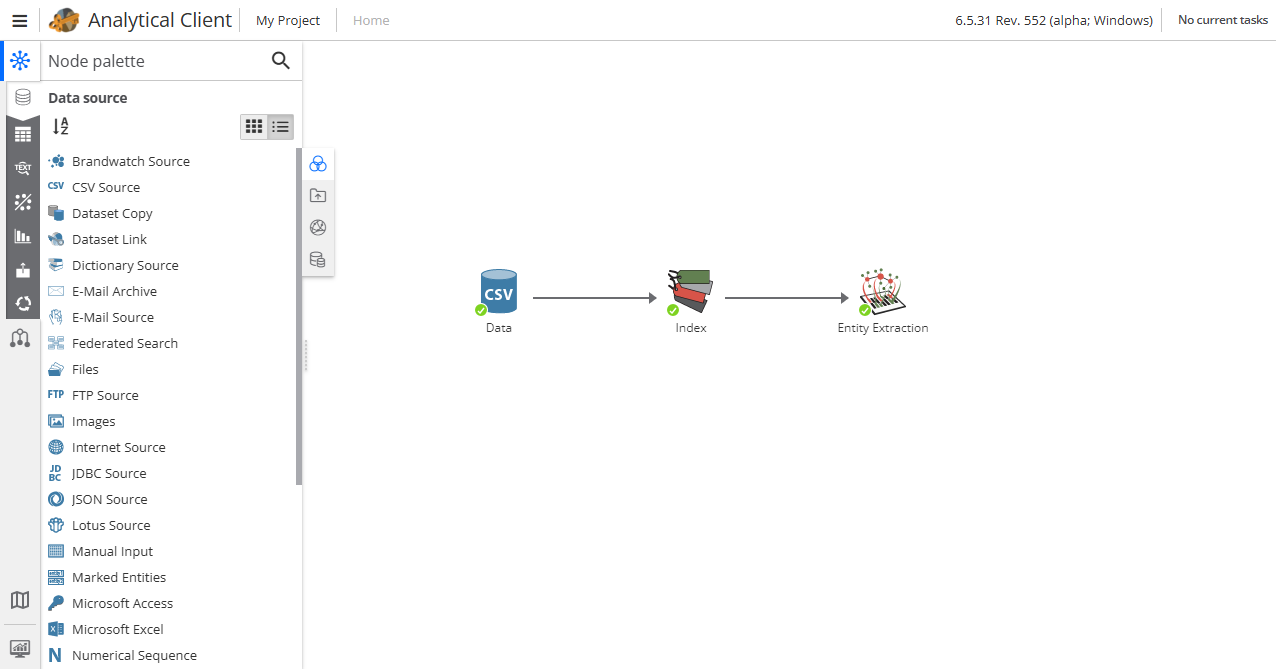
Flowchart
This refers to the large window with a white background, where you can layout the nodes you wish to use in a project.
Users can customize flowchart display settings. When you first use PolyAnalyst in this tutorial, you may not see the flowchart window. This area of the PolyAnalyst window is also where other windows will appear. For example, if you were to view a table of data, the table would appear in the area where the flowchart window appears.
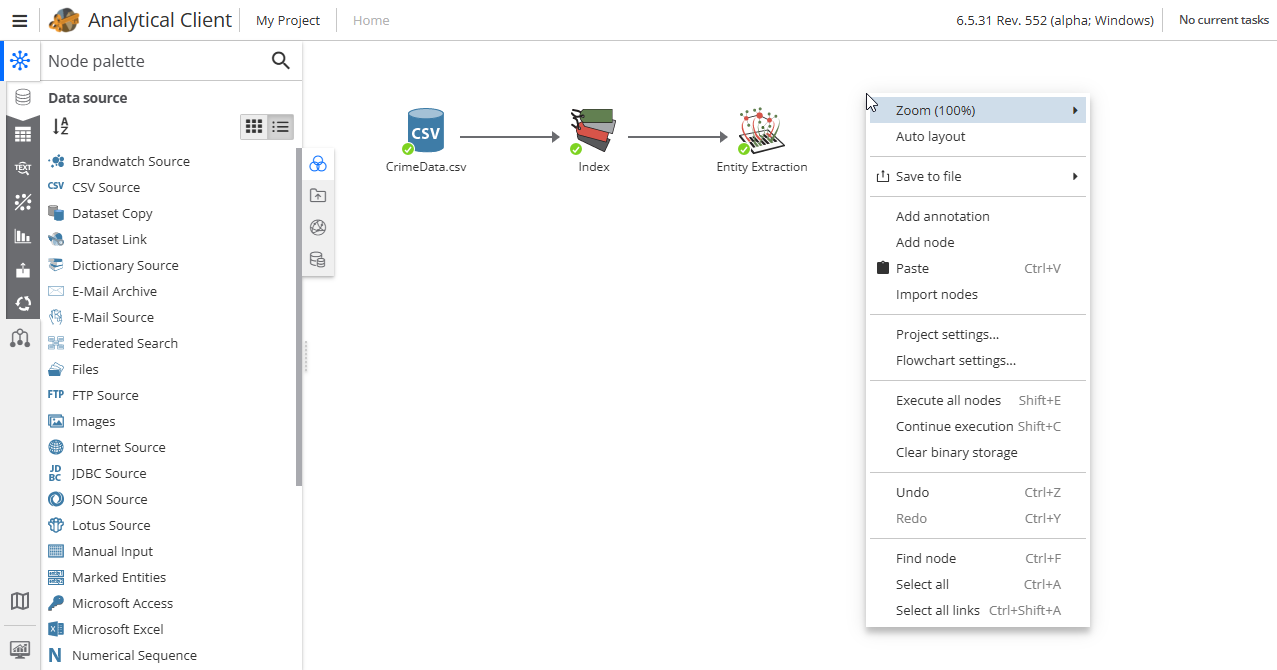
By right-clicking the flowchart you can use the following options:
-
Zoom – zooming in and out.
-
Auto layout – the elements of the script (node icons) are located automatically.
-
Save to file – script export (Export to image или Export to PDF).
-
Add annotation – press to add an annotation.
-
Add node – press to add a node; the window will open, where you can select a node category and/or a node.
-
Paste – press to paste a copied node; if the copied node has a parent node, the pasted node will be linked to the same parent node. The option also allows you to paste the annotation text from the clipboard.
-
Import nodes – provides access to nodes that have been imported into the report from the Analytical Client.
-
Project settings… – find more information about this option here.
-
Flowchart settings… – find more information about this option here.
-
Execute all nodes – allows you to execute all nodes in the project.
-
Continue execution – allows you to execute all nodes in the project that can be executed.
-
Clear binary storage – clearing the binary storage of the current project. The binary storage stores all the binary data that are downloaded by the Data import from Internet source nodes. The action can be canceled if the project has not been saved. This option can be accessed by users who have rights to write the project.
-
Undo – opens a list of actions to undo.
-
Redo – opens a list of actions to redo.
-
Find node – enables searching for nodes in the project.
-
Select all – highlights all nodes in the flowchart.
-
Select all links – highlights all node links in the flowchart.
Minimap
The minimap is a zoomed out overview of the nodes within a flowchart. Using the minimap is helpful when navigating larger projects. The minimap is interactive and provides a simple way to change the currently visible area of the flowchart. In the following image, the minimap is located in the lower-left corner of the Analytical client window:
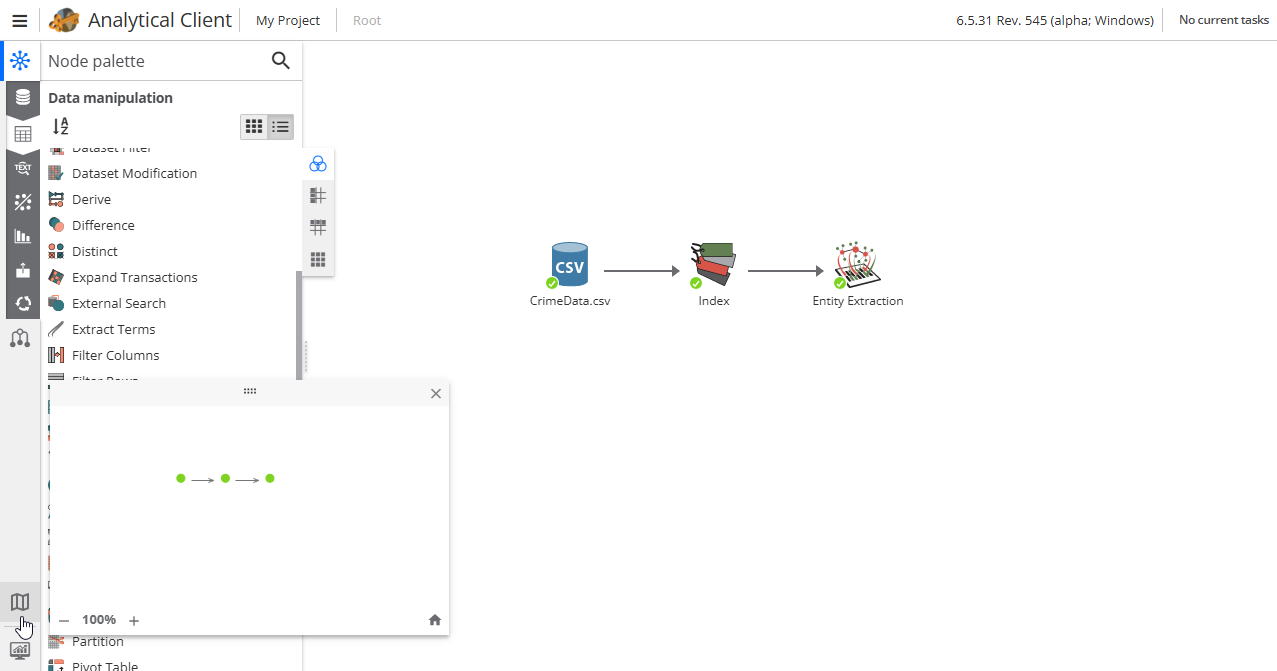
When PolyAnalyst is first installed and opened, the minimap is configured to be displayed in the lower-left corner. However, it can be detached, closed, resized, and moved around to other corners of the window.
Each dot on the minimap corresponds to a node on the flowchart. Each line on the minimap corresponds to a connection.
The color of each dot corresponds to the state of each node. Red dots correspond to the not ready state. Yellow dots correspond to the ready state. Green dots correspond to the completed state. See node states for details.
The blue rectangle represents the currently visible portion of the flowchart window. The rectangle only appears when the flowchart is large enough to require scrolling.
To jump to a different visible area, left-click on the desired general area in the minimap (anywhere outside of blue rectangle).
About the items displayed in the status bar
The status bar is located at the bottom of the PolyAnalyst window. It consists of the following items:
-
Sent and Received – The Sent and Received metrics display the number of bytes sent to and received from PolyAnalyst Server. Due to the constant connection to the server, and the constant flow of data these numbers will continually increase.
-
Profile – This item on the status bar contains the username of the current user.
-
Connection – This area displays the Internet address of the server to which the client is connected. If the server is running on the same computer, then this displays either
localhostor127.0.0.1. The value may be displayed as an IP address or a domain name. -
Auto-reconnect – This icon represents whether the client will automatically reconnect to the server if the connection is lost for some reason (e.g., if the server stopped working or the server was restarted).
-
Credentials icon – An icon that represents how the server is configured to run on Microsoft Windows:
-
the "empty mask" symbol – impersonation is not used (the server uses the account that started rServer.exe)
-
the "crossed empty mask" symbol – impersonation level is "identity" (the server identifies the user, but does not use his credentials)
-
the "face with a mask" symbol – impersonation level is "impersonated"
-
the "face without a mask" symbol – impersonation level is "delegated"
-
-
Server load – This shows approximately how many resources are being used by PolyAnalyst Server.
-
Connection status – This item displays whether the client has an active connection to the server.
Keyboard shortcuts (for the native version of the Analytical Client)
Several options in PolyAnalyst are accessible by using keyboard shortcuts. Available keyboard shortcuts are listed in the menu located at the top of the Analytical client next to each option (see the picture below).
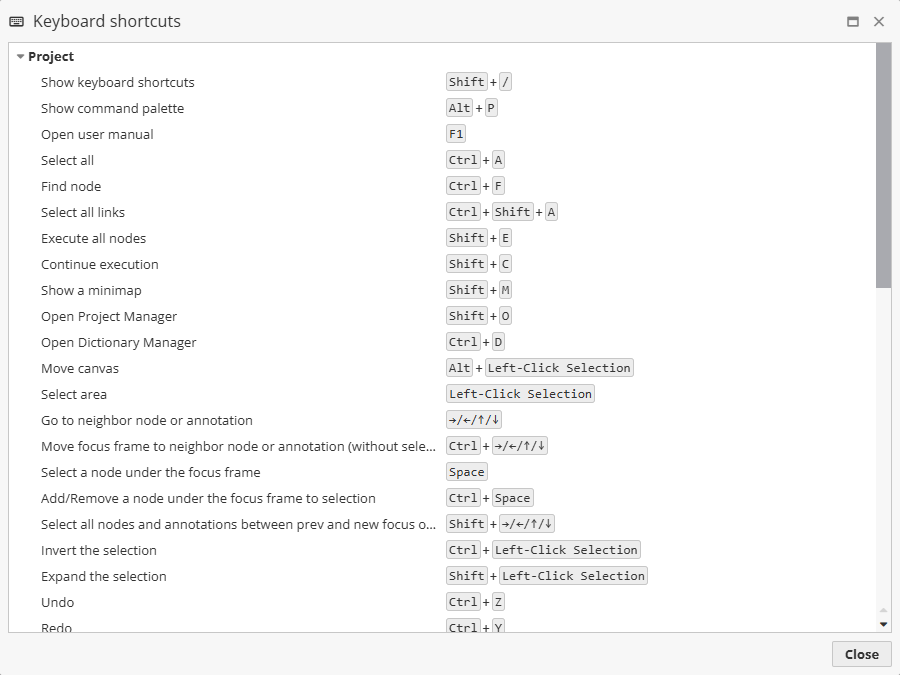
The list of shortcut keys in PolyAnalyst is given below:
| Name | Shortcut keys |
|---|---|
New project |
Ctrl + N |
Open |
Ctrl + O |
Save |
Ctrl + S |
Save as |
Ctrl + Shift + S |
Close |
Ctrl + W |
Revert |
Ctrl + R |
Manage projects |
Ctrl + M |
Manage dictionaries |
Ctrl + D |
Print control |
Ctrl + P |
Execute |
Ctrl + E |
Continue execution |
Shift + F5 |
Scheduled tasks |
Alt + S |
Edit project properties |
Alt + F7 |
Show flowchart |
F9 |
User settings |
Ctrl + Alt + F7 |
Program settings |
Alt + Shift + F7 |
| Window | |
|---|---|
Cascade |
Ctrl + Shift + J |
Tile horizontally |
Ctrl + Shift + K |
Tile vertically |
Ctrl + Shift + L |
Using annotations
See Working with annotations for more information.