Adding nodes to a flowchart
The process of adding a node to your project generally begins with selecting the appropriate node from the Node palette. By default, the palette is visible and located on the left side of the PolyAnalyst Analytical client window.
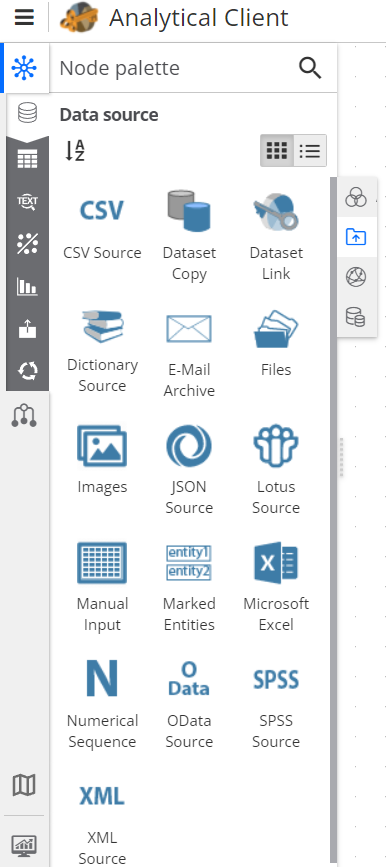
The palette panel may be hidden, resized, and repositioned. If you cannot see the palette, click the Node palette  button in the upper left corner.
The palette is organized into the following categories:
-
Data source: nodes for importing data.
-
Data manipulation: nodes for changing columns and rows of a dataset.
-
Text analysis: nodes for analyzing unstructured data (text).
-
Data analysis: nodes for analyzing structured data.
-
Visualization: nodes for creating various data visualizations.
-
Data export: nodes for exporting data.
-
Utility: nodes for obtaining various kinds of additional information, such as viewing error logs, event tracking, etc.
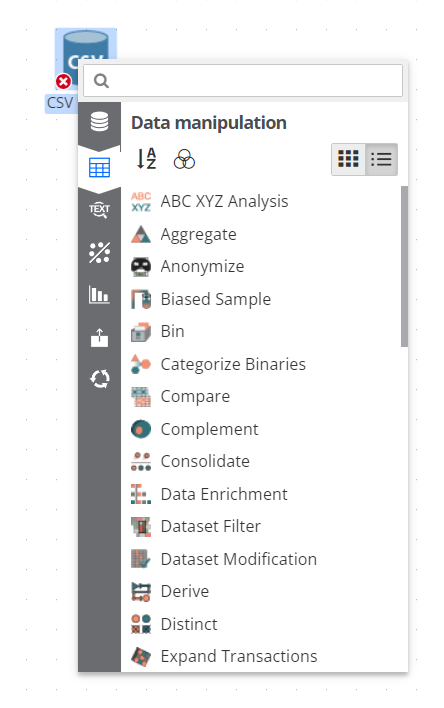
Searching the palette by node name
To search the palette, begin typing the first characters of the name of the node you are looking for in the Search window located above the node palette. The palette will immediately change to display the matching nodes with highlighting.
Tips for choosing a node
Selecting the proper node to add to your analysis requires some practice. There are several nodes to consider. Start by narrowing the scope of your search to particular palette category and looking for a node with a name that seems to accomplish the objective.
If you’re struggling to find the proper node, you may be looking in the right node palette category, but with the wrong granularity. In other words, your objective could be too specific or too abstract. In some cases, maybe you need to use two nodes in place of one.
Alternatively, maybe what you want to do is just one sub-task of some more general purpose node.
In addition, consider the other ways an operation may be named.
Otherwise, consult the Node reference section of this documentation. Read the topics for each node to quickly get a feel for what each node does and determine its relevance to your objective.
Using the right approach for analysis
Sometimes selecting the right node is not enough. You may also need to decide on the right approach when there is more than one way of doing something.
There is not always a clearly better method. The criteria for your decision vary from case to case. Perhaps one of the alternatives is more efficient, or more scalable. Perhaps one method is simpler to maintain, more flexible, less error-prone, or less tedious.
About node positions
The positioning of the nodes on the flowchart has no effect on the order in which nodes process data. Only connections between nodes determine processing order.
You may prefer to use a left-to-right, top-to-bottom convention, similar to English text, to reflect the order in which nodes are executed.
Example flowcharts
When perusing the following examples, focus on the bigger picture.
Analyzing survey responses
The following flowchart is a basic example of how you might use PolyAnalyst to explore the results of a survey containing an open-ended question. An open-ended question is a survey question that expects an unstructured, essay-like response that is usually in the form of a brief phrase, a few sentences, or a few paragraphs. For example, "how happy are you with your recent purchase?"
In this example, the nodes are intentionally positioned to emphasize that node placement is irrelevant to node processing order. The only important concepts here are (1) the presence of particular nodes, and (2) the connections between the nodes.
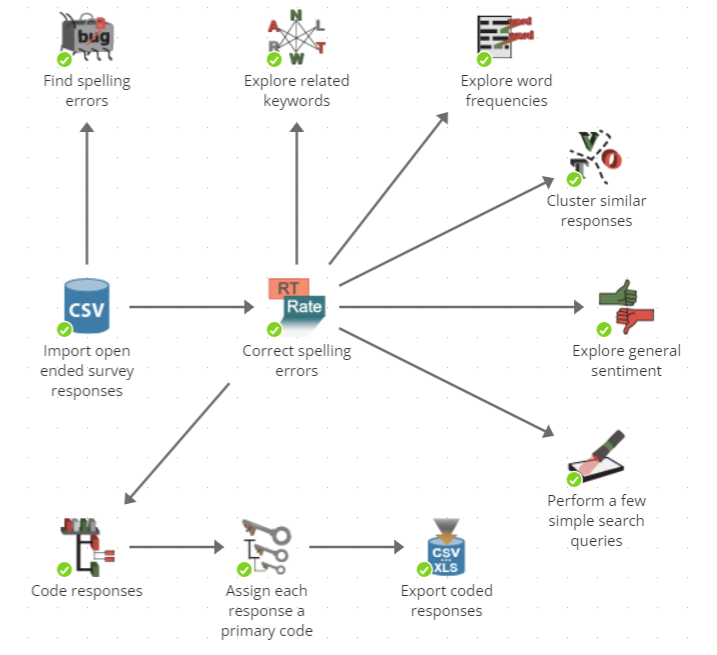
The starting point in this example is the CSV Source node labeled `Import open ended survey responses'. This example assumes that you have collected the survey results in a CSV file. The node imports the contents of the CSV file into PolyAnalyst as a table (a dataset). Imagine each row in the data corresponds to a respondent, and each column corresponds to a question in the survey.
The output of this node is fed into a Replace Terms node named "Correct spelling errors". This next node searches for misspelled words and replaces them within the open-ended question response in the survey.
Next, the text of the open-ended question response is explored. Using a variety of nodes, exploratory reports are generated to examine information such as related words and frequent words. Respondents are grouped together in the Text Clustering node on the basis of discussing similar issues within their response. The Sentiment Analysis node generates a report showing which responses were generally positive and which were generally negative or neutral.
Next, the survey responses are fed into a classification tool called Taxonomy where each response is assigned a code. The taxonomy produces a report that enables you to explore the distribution of the responses among the codes. The Score taxonomy node next adds a new column to the survey that stores the most relevant code for each textual response.
Finally, the coded responses, together with the original columns from the input, are exported to a file.
From a more general point of view, the following steps were performed:
-
Survey data was imported.
-
The data was "cleaned".
-
The text responses were analyzed.
-
The text responses were categorized.
-
The categorized responses were exported.
The ideas gained from exploring the data often help form the codes that are chosen to classify the data in the Taxonomy node. Therefore, exploratory analysis followed by modeling is a typical progression.
The path along the middle of the sequence, from importing the survey data to classifying it and exporting it, forms the core of the analysis. When new survey responses become available, this same sequence can apply to the new responses. PolyAnalyst is specifically designed to minimize the amount of reconfiguration needed to perform the same analysis on new data.
Simple, iterative refinement is also one of PolyAnalyst’s core design goals. If you find that you have made a mistake in configuring one of the intermediate steps of the sequence, or wish to introduce new intermediate steps, you can jump to any point in the process and make changes. You do not have to start from scratch.
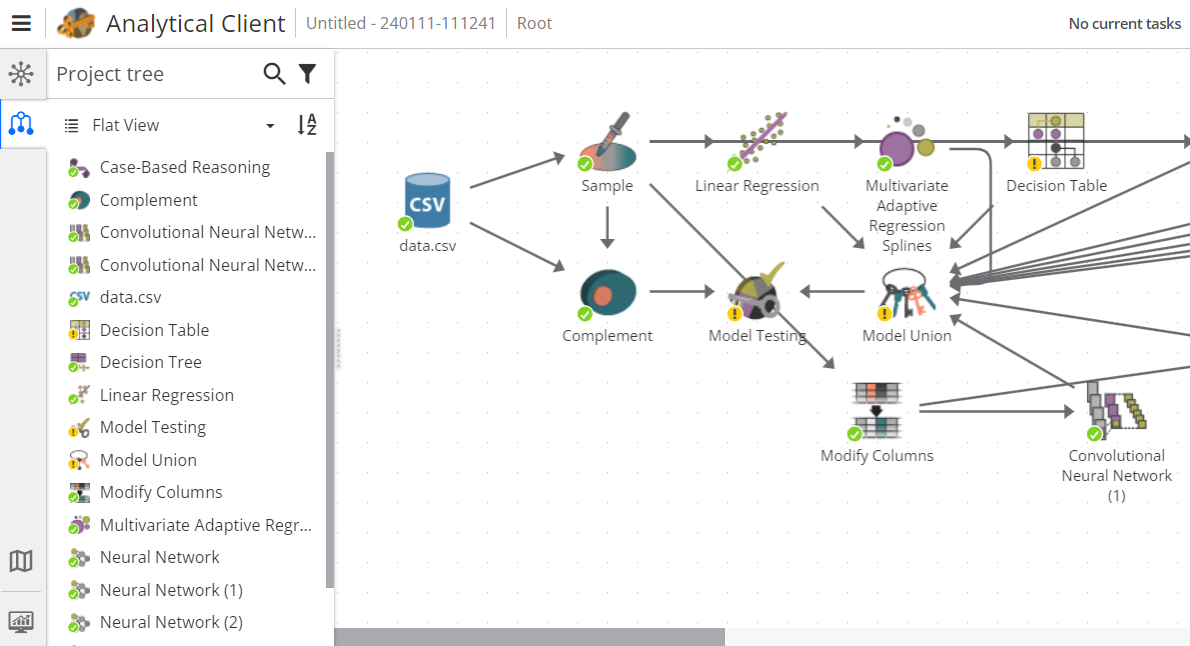
Scoring data
This is a basic example of training a model on a sample and then applying the model to new data.
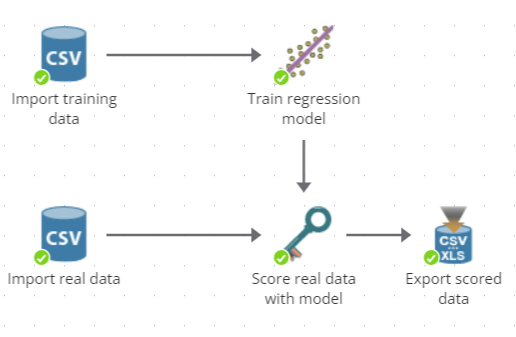
A sample is imported by the CSV Source node labeled `Import training data'.
This data is input to the Linear Regression node labelled "Train regression model". In parallel, other data is imported. Initially, the model has no knowledge of the other data until the model is applied to the other data using a Score node.
Finally, the scored data is exported to a file.
The default name and position of new nodes
Whenever you add a node to the flowchart, PolyAnalyst provides a default name for the node. The default name is derived from the generic name of the node displayed in the palette.
Every node that you add to a project’s flowchart must have a unique name. If you add the same node to the flowchart multiple times, PolyAnalyst provides a unique name using a numbered suffix, such as `Default name (1)' or `Default name (2)'.
Once a node is added to the flowchart, you can change the name.
Whenever you add a node to the flowchart, you will need to choose a position for the node. You can freely reposition nodes by dragging a node’s icon.
| Avoid overlapping node placement so as to minimize confusion. |
Add a CSV Source node to the flowchart
Adding nodes to the flowchart of a project is fairly straightforward.
For example, perhaps you want to add a CSV Source node to the project flowchart.
-
Verify that the project you created is open. If it is closed, select Open in the menu, and then select the project and open it.
-
Confirm that the Node palette is visible.
-
Locate the Data source category of the node palette.
-
Locate the CSV Source node within the Data source category.
-
Drag the CSV Source node from the node palette and drop it onto the flowchart. To do this, left click down on the name of the node within the palette. While holding the left mouse button down, move the mouse cursor over to the flowchart window, and then release the left mouse button.
You should now see a flowchart that looks similar to the following image:
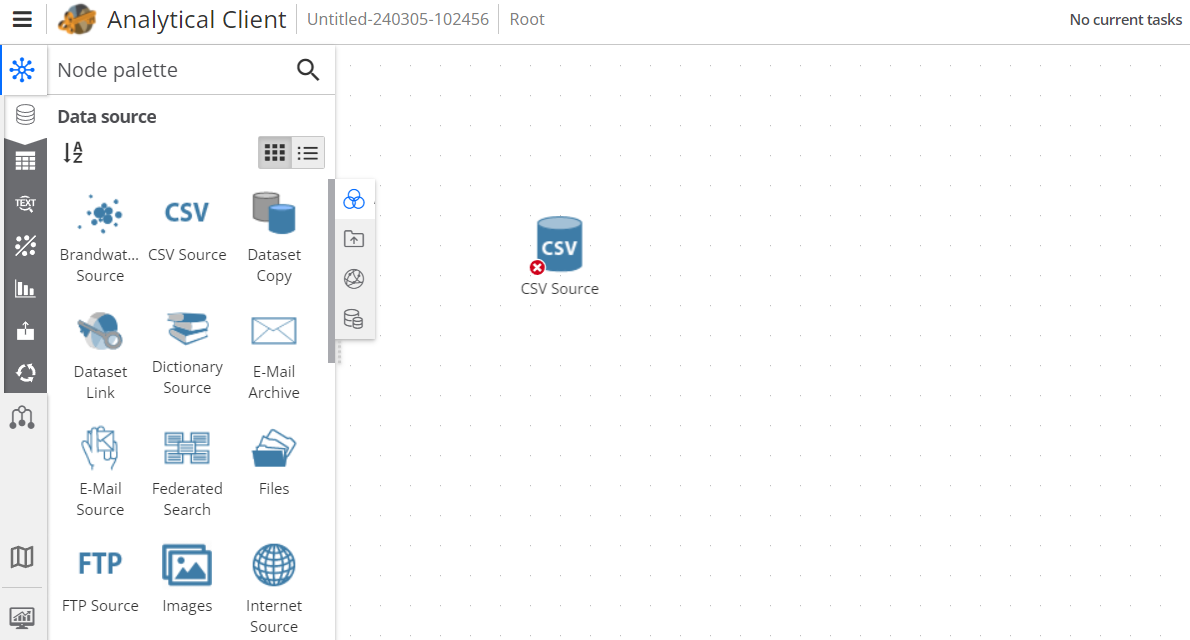
At this point, the node cannot perform any action, and does not produce any result. No data was imported yet.
Other methods for adding nodes
-
Double click on the node’s icon or name in the palette. The new node will be positioned for you automatically on the flowchart. You can then reposition the node.
-
Right click on the node in the palette and select Add to project. The new node will be positioned for you automatically on the flowchart. Again, you can then reposition the node.
-
Right click in an empty area of the flowchart window and select the node to add from the Add node submenu of the right click menu. The new node will be positioned near the areas where you right clicked.
-
Right click on an existing node on the flowchart and select the node to add from the Add node… submenu. In this case, the new node will be positioned for you automatically, and it will be connected to the node that you right clicked.
Here is an example of the Add node… submenu you can access when you right click on an existing CSV Source node from the project flowchart.
-
Drag and drop a CSV file from your computer to the script, which will automatically load the file and create the corresponding pre-configured CSV Source node. In addition to files in CSV format, it is possible to drag and drop files in XLS, JSON, XML formats, as well as any images, documents and archives.
An introduction to the Project tree
When a project grows larger after adding several nodes, it can be difficult to locate a node in the project. The Project tree presents an alternate hierarchical view of the nodes that you have added to your project. The drawback of using the tree is that the tree does not show how nodes are connected.
To view the Project tree, click on the Project tree button in the upper left corner under the the Node palette button.
More detailed information about the organization of nodes in the project tree can be found in the An introduction to the PolyAnalyst interface section.
To clarify the difference between the tree and the palette: the palette displays nodes that can be added, whereas the tree displays nodes that are already added.
Whenever you add a new node to your flowchart, it also appears in the project tree. Similarly, if you remove a node from the flowchart, it is removed from the project tree.