Viewing distinct values for a column
There are several ways to view distinct values for a column in PolyAnalyst. One of the simplest ways is to use the Distinct tab that is present in most of the views of data in the output of nodes in a PolyAnalyst project. The Distinct tab displays a list of all the columns in the dataset on the left. The tab looks as follows:
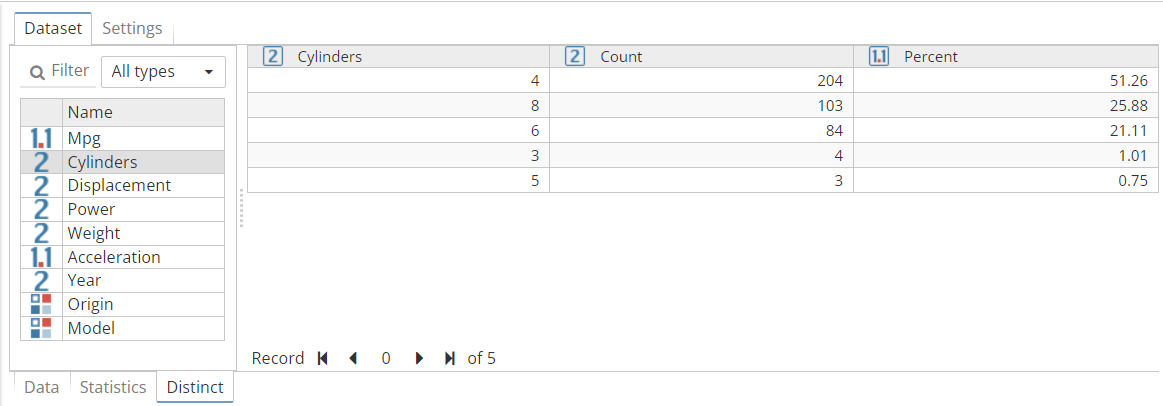
To view the distinct values for a column, select the column from the column list on the left side of the Distinct tab. The right side of the tab then updates to display the distinct values of the selected column. For each distinct value, a count is calculated.
Text columns are not displayed in the list of columns of the Distinct tab
Generating a distinct set of values for a column involves a large amount of comparison operations. The Distinct tab excludes text columns because comparing large amounts of unstructured text to determine whether two values are equal is not a simple operation. There are two primary reasons why:
-
In comparison to determining whether two numbers or two dates are equal, comparing the contents of several large text values character by character is slow. This is not a scalable operation.
-
The logic involved in the comparison of two large text values is poorly defined. For example, it is generally very clear whether a number is identical to another number, or a date is equal to another date. It is generally not clear whether two documents are the same. For example, should the comparison ignore whether one of the documents is in all uppercase? What if there exists a single extra line or single extra space in one of the documents?
If you need to compare text values, consider using a Derive node to capture a subset of the text (e.g. the first 200 characters) in a new String column. PolyAnalyst can then easily compare the String values to one another. Another avenue to consider is to use a Distinct Texts node.
Sorting the column list
You can sort the column list by the data type or name. To sort the list, right click on the Name column header and select the desired sort option (e.g. Sort ascending/descending) from the right-click menu.
By default, the list is sorted in natural order, the order of the columns as stored in the dataset. You can return to using the natural order (after having chosen to sort by another order) by selecting the appropriate option in the right-click menu for the Name column header.
Viewing the number of distinct values
The total number of distinct values for the column is displayed in the navigation bar area of this right list (usually at the bottom, if visible). If the navigation bar is not visible, click the Toggle navigation bar button on the toolbar at the top of this window.
You can also view the number of distinct values for a column from the output of the Statistics tab (in the Distinct property of a column), which is sometimes a simpler and faster method than using the Distinct tab. In contrast, the Distinct tab is better utilized when you want to view specific counts of different distinct values.
Searching distinct values
You can search the list of distinct values similar to how you search the values of a column in the data viewer. See the topic on searching for values using the data viewer for more information.
Exporting distinct values to a file
You can export the list of distinct values for a column to a file, similar to how a dataset is exported. See the topics on exporting data for more information.
Performance information
The Distinct tab is provided primarily for quick access to distinct values for smaller datasets. When you first decide to view the distinct values, PolyAnalyst calculates the number of distinct values for each column in the dataset. This operation works column by column (in natural column order), and can sometimes take several seconds, minutes, or even hours when working with a very large number of columns. During the time this calculation occurs, a progress bar is displayed on the screen.
When you click on a column to view its distinct values, a similar operation occurs where PolyAnalyst determines the different values in the column and the count for each distinct value. During this time a progress bar is displayed on the screen. This operation can take a considerable amount of time when working with a very large dataset (e.g. several million records).
When working with larger data sets, consider using the Distinct node as an alternative to using the Distinct tab. The Distinct node is more efficient and scales very well for working with very large data sets.
Creating a dataset of distinct values using the Aggregate node
You can recreate a dataset that is similar to the output of the Distinct tab using the Aggregate node (not to be confused with Aggregate Values). The Aggregate node is located in the Table Operations branch of the node palette.
-
Add a new Aggregate node to your flowchart.
-
Connect the node that outputs the data you are viewing to the Aggregate node.
-
Configure the node to use the desired column as the aggregate key.
-
Check the Include row count column as option within the Aggregate node's properties window.
-
Click on Execute.
-
View the results of the Aggregate node.