Resizing columns when viewing data
To change the displayed width of a column in the data grid:
-
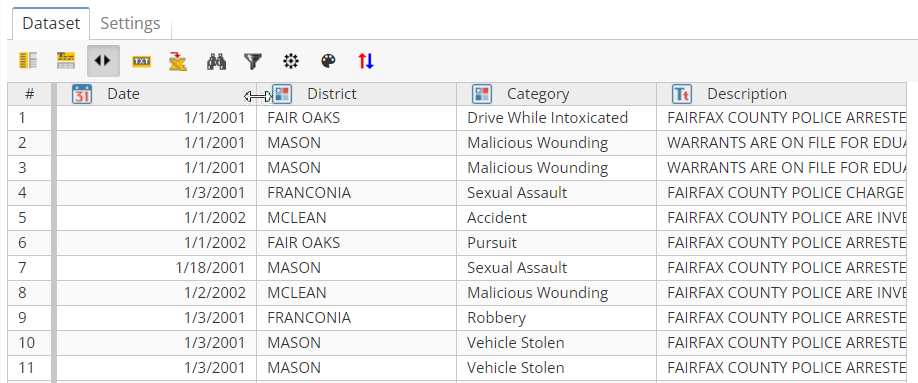
Hover the mouse over the small vertical line delimiting the column headers. The change width icon appears, as shown in the following diagram where the mouse is hovering between the Date and District column headings
-
Left click down, and while holding the mouse button down, drag the column edge left or right. This will increase or decrease the size of the column.
Each column has a minimum width. PolyAnalyst stops the resize operation when this point is reached in the case of decreasing the size of the column.
To set the width of a column automatically, double click on the right edge of the column.
Configuring column display properties when viewing data
The data grid can be customized to display various columns according to a particular format (e.g. interpreting contents of a numerical column as monetary values, etc.). This is similar in metaphor to customizing the format of cells in a Microsoft Excel spreadsheet.
About the Column properties window
To access the Column properties window, right-click any column header and select Configure in the context menu.
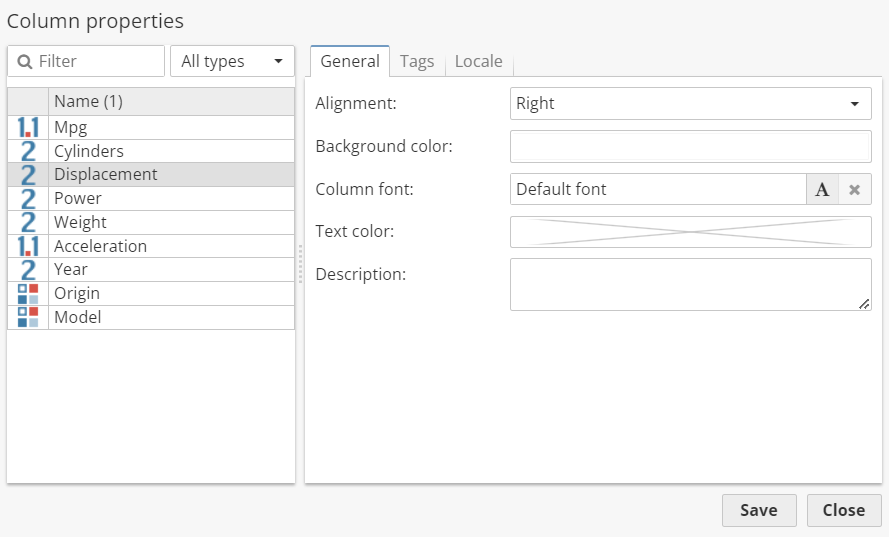
The window is divided into two sections. On the left there is a list of dataset columns. The available options are organized into three tabs and displayed on the right.
| Changes made on the Column properties window of the parent node are applied to all of its successive nodes, but have no effect on the upstream nodes. |
Options of the General tab allow users to configure the alignment, background color, font and edit the description of the column. Once added, the description is displayed by means of a tooltip which appears when you hover the cursor over a column header in the data grid.
| Certain nodes like Modify Columns, Filter Columns or Join are unable to retain the description of the column in the output. |
For Integer, Numerical and Boolean columns you can check the Conditional formatting option to introduce additional highlighting to the data grid.
The Tags tab can be used to add tags to the selected columns. See the Tagging columns section for details.
Options on the Locale tab are used to change the format of column values. Thus, you can customize the decimal point, add suffixes, change number format and so on. Note, however, that this affects only the appearance of values in the data grid, not the actual values. Other algorithms or nodes will access and use the original values.
When finished configuring options on the Column properties window, click Save to refresh the data grid.
How to customize the data viewer
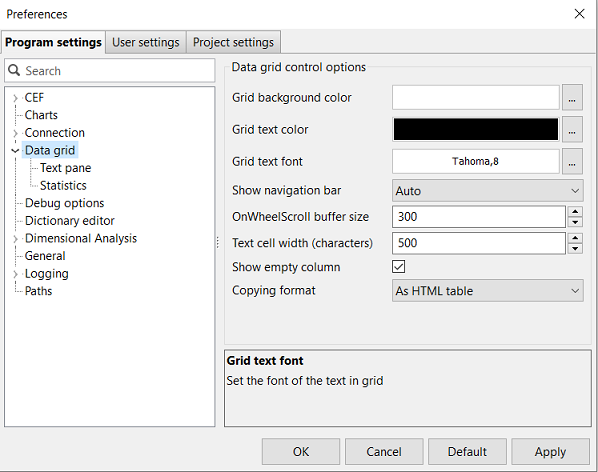
The settings of the Data viewer window in the native version of the Analytical client can be changed. To do this, select Program settings from the Settings menu. In the Program settings window, navigate to the Data grid section. These settings deal with the behavior of the data grid, which is used to display the rows and columns of a set of data.
-
Grid background color – allows you to set the data grid background color.
-
Grid text color – allows you to set the data grid text color.
-
Grid text font – allows you to set the data grid text font.
-
Show navigation bar – sets the behavior of how to display the navigation bar. The options are Always, Never, and Auto. The Auto option will conditionally display the bar where relevant.
-
Scroll buffer size – this is an advanced option that controls how many rows the grid will scroll upwards and downwards when viewing data and scrolling. This will affect the scrolling speed, as PolyAnalyst is loading and unloading rows into the view. The larger the buffer, the more rows can be loaded at once, so less calls to load the data repeatedly will occur, so the faster the scroll and display. However, a large buffer means more data is transferred from the server to the client, and depending on the latency between the client and server, may cause scrolling to take even longer.
-
Text cell width – allows you to set the data grid cell width by specifying the maximum number of characters in a cell. PolyAnalyst does not actually display the full value of each cell because this would take up too much computer memory when running PolyAnalyst on large data. However, as this may be an inconvenience to some users who wish to see the full data in the cell, they can increase the size of the cell width here. Increasing this value will cause a proportionally larger amount of RAM to be used on your computer, as well as require additional information to be sent from the server to the client, which may decrease performance.
-
Show empty column – allows you to specify whether the unused space in the grid should be displayed as an empty column or as a blank gray space.
-
Copying format – allows you to specify the format in which the table is copied into the clipboard.
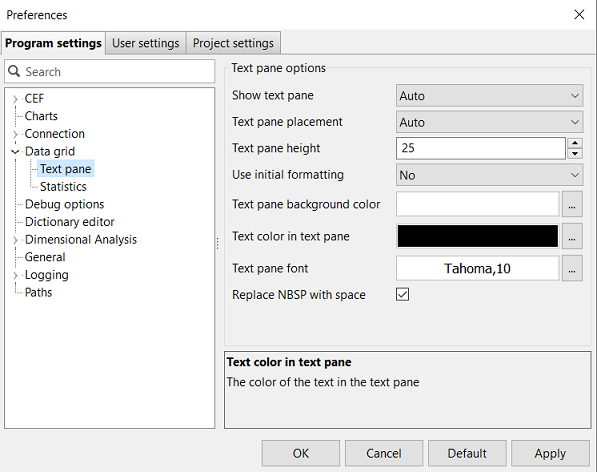
The Text pane is a component of the data grid which displays the full contents of the selected cell in the grid.
-
Show text pane – sets whether the text pane should be visible or hidden by default. Alternatively, you can let PolyAnalyst determine it automatically.
-
Text pane placement – sets whether the text pane should appear above or below the grid.
-
Text pane height – sets the initial height of the text pane.
-
Use initial formatting – controls the format of text in the text pane and allows you to display the formatting of the input text (e.g. font, spaces, etc.). If set to No, the values in the text pane are displayed in a basic normalized format, irrespective of the format of the input text.
-
Text pane background color – sets the background color of the text pane. A light color is recommended.
-
Text color in text pane – sets the foreground color of the text in the text pane. A darker color is recommended, one that is easy to read and contrasts with the background.
-
Text pane font – sets the font type and font size of the text in the text pane.
-
Replace NBSP with spaces – allows you to replace non-break spaces with usual spaces and affects the text copied directly from the text pane.
The Statistics tab is a component of the data grid. It is usually the 2nd tab of the View window.
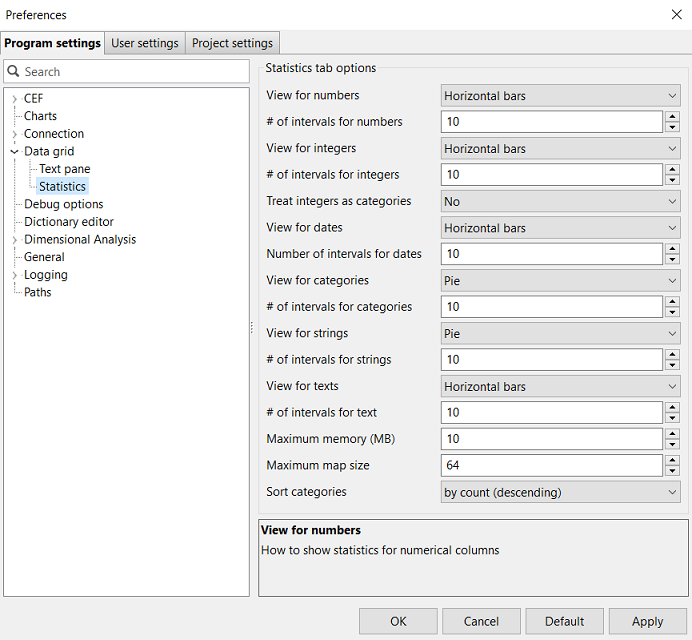
-
View for numbers – sets the chart type for a numerical column. The drop-down menu to the right of the option allows users to choose between horizontal, vertical, 3D bars, pie or doughnut diagrams.
-
Number of intervals for numbers – sets the number of intervals for a numerical column.
-
View for integers – sets the chart type for an Integer column.
-
Number of intervals for integers – sets the number of intervals to use for an Integer column.
-
View for dates – sets the chart type for date columns.
-
Number of intervals for dates – sets the number of intervals for date columns.
-
View for categories – sets the chart type for categorical columns.
-
Number of intervals for categories – sets the number of intervals for categorical columns.
-
View for strings – sets the chart type for String columns.
-
Number of intervals for strings – sets the number of intervals for String columns.
-
View for texts – sets the chart type for text columns.
-
Number of intervals for text – sets the number of intervals for text columns.
-
Maximum memory (MB) – sets the maximum memory usage in statistics computation ranging from 1 to 1000.
-
Sort categories – sets the sorting order for category computation.